That is what everyone wonders after the much-anticipated first Clinton-Trump debate. Polls were mixed but from a fundamental perspective, the right answer is probably Neither, as Michael Tracey eloquently explained in his Tweet.

@mtracey – A quick thought on who “won” the debate, and why that’s a fundamentally useless question
My two cents (or two yen since I live in Japan) is that Clinton was more composed throughout the debate, and one thing without a doubt is that she proved critics of her health wrong about whether she could last 90 minutes of debate non-stop. US equity markets and futures seemingly were panicking ahead of the debate, but dip buyers were at least temporarily the winners with S&P futures +13 as of 1am EST after being down as much as -10 (**but back to flat on weakness in Europe as of 9am EST).
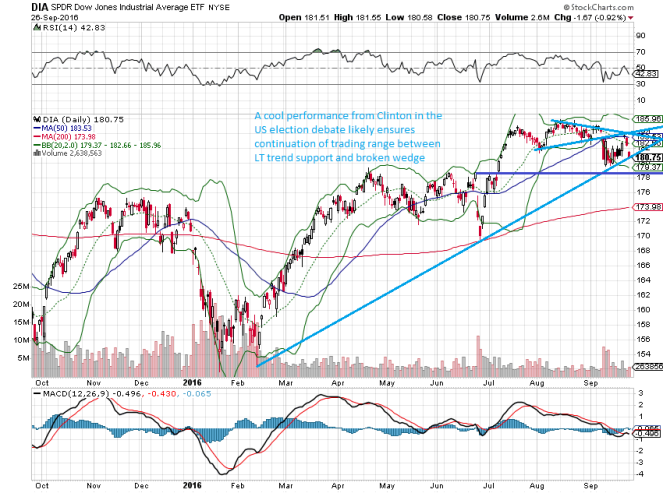
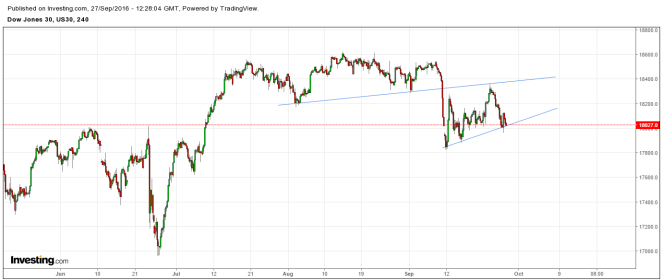
Looking at the daily closes, DIA dumped right into the LT trendline support again, but likely gap back up towards 20DMA and 50DMA and ensures the ongoing trading range between 180.5 and 184 (broken wedge resistance) is intact. The short-term strategy is to continue trading the edges until one side breaks. There will be plenty of catalysts with more debates coming, as well as beginning of earning season.
Moving elsewhere, crude oil (+3.2%) was a big mover on speculation that a production deal is near among OPEC countries.
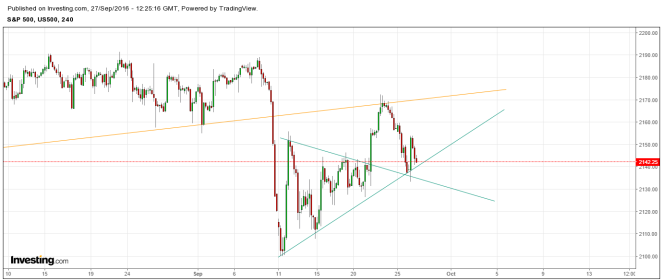
But on the bigger picture, we are simply oscillating within a very large wedge until one side breaks .
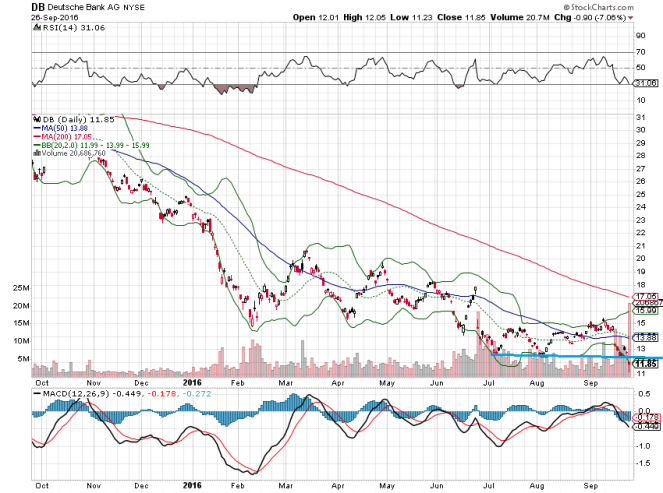
Across the pond, Deutsche Bank continues to be on the headlines, and plunged again today on news that the German government would not bail them out. As a former employee, I wish them luck that they are not the next Bear Stearn or worse like many said. Technically, things look dire with the break through the triple bottom.
Day Ahead – Events and Economic Data
| Time | Event / Data | |
| 10am | Consumer Confidence | |
| 11:15am | FOMC Member Stanley Fischer speaks |
Quantitative Strategy – Automated Portfolio Update
Performance
| ASSET CLASS | TYPE | LONG/SHORT | DAILY RETURN % | MTD % | QTD% |
| Equities
|
Short-Term
|
Long Only | -0.67% | 1.02% | 5.11% |
| 0.17% | 1.12% | -0.49% | |||
| Long/Short | -0.25% | 1.06% | 2.63% | ||
| Medium-Term | Long Only | -0.40% | 0.60% | 9.04% | |
| ETF | Short-Term | Long Only | -0.55% | 5.17% | 5.7% |
| Short Only | 0% | 3.59% | -3.70% | ||
| Long/Short | -0.55% | 4.75% | 0.45% | ||
| Medium-Term | Long Only | -0.69% | 2.66% | 4.65% | |
| Futures | Short-Term | Long/Short | 0.17% | 2.65% | -1.7% |
| FX | Short-Term | Long/Short | 0% | 3.18% | 3.62% |
| SPX | Benchmark Index | -0.86% | -1.14% | 2.25% |
Daily Trades
Equities Short-Term Long
| SYMBOL | NAME | NEW/EXIT POSITION | DAILY CLOSE | INITIATE DATE | INITIATE PRICE | PNL | WINGTREND | SIGNAL PROJECTION AT INITIATION (2-WEEK) |
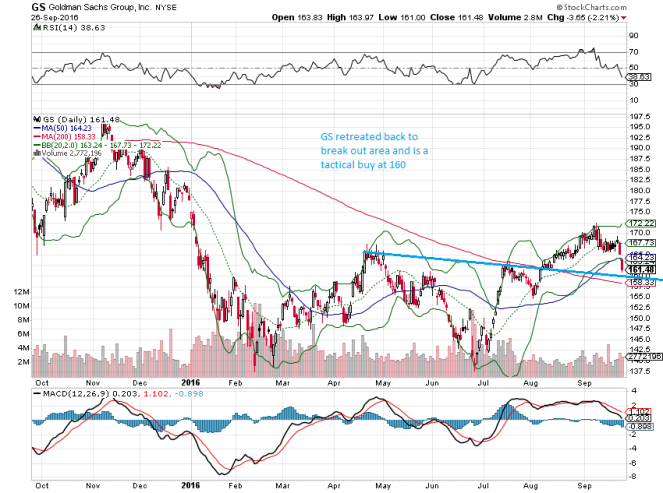
| GS | Goldman Sachs Group | New | 161.48 | 2016-09-26 | 161.48 | 0% | · 2.67
-4.39 |
· 172.87
7.05% |
| *NUE | Nucor Corp. | New | 48.92 | 2016-09-26 | 48.92 | 0% | · 0.11
-4.19 |
· 51.61
5.5% |
| CRM | Salesforce.com | Exit | 70.19 | 2016-09-15 | 73.99 | -5.14% | · -10.75
-15.74 |
· 83.47
12.81% |
| CXO | Concho Resources | Exit | 126.51 | 2016-09-13 | 124.52 | +1.6% | · 16.51
-5.04 |
· 155.50
24.88% |
| GGP | General Growth Properties Inc. | Exit | 28.66 | 2016-09-13 | 27.49 | +4.26% | · -0.12
-3.81 |
· 33.56
22.09% |
| WY | Weyerhaeuser Corp. | Exit | 31.64 | 2016-09-13 | 30.00 | +5.47% | · 3.07
2.46 |
· 36.77
22.56% |
Equities Short-Term Short
| SYMBOL | NAME | NEW/EXIT POSITION | Exit Price | INITIATE DATE | INITIATE PRICE | PNL |
| AIV | Apartment Investment & Mgmt | New | 2016-09-26 | 47.59 | 0% | |
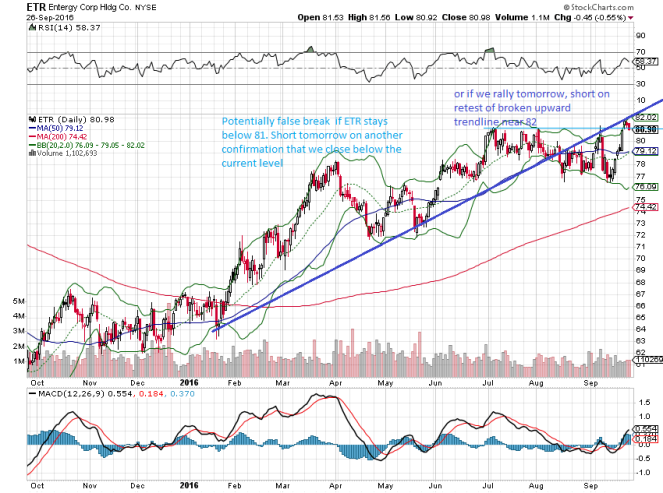
| ETR | Entergy Corp. | New | 2016-09-26 | 80.98 | 0% | |
| LM | Legg Mason | New | 2016-09-26 | 33.02 | 0% | |
| AXP | American Express Co | Exit | 63.42 | 2016-09-20 | 63.72 | 0.47% |
Equities Medium-Term Long
| SYMBOL | NAME | NEW/EXIT POSITION | INITIATE DATE | INITIATE PRICE | PNL |
| GS | Goldman Sachs Group | New | 2016-09-26 | 161.48 | 0% |
| LRCX | Lam Research | New | 2016-09-26 | 91.41 | 0% |
ETF Medium-Term Long
| SYMBOL | NAME | NEW/EXIT POSITION | INITIATE DATE | INITIATE PRICE | PNL |
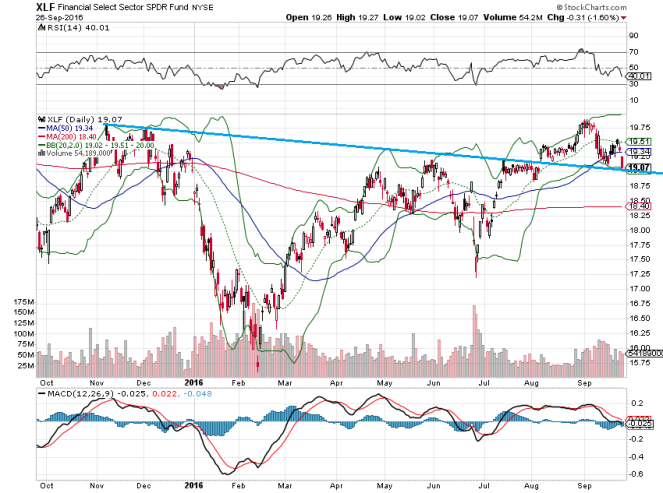
| XLF | SPDR Select Sector Fund – Financial | New | 2016-09-26 | 19.07 | 0% |
| XLE | SPDR Select Sector Fund – Energy Select Sector | Exit | 2016-08-29 | 69.85 | -3.59% |
Chart in Focus
XLF – Medium-Term Long
Target: 19.5
Entry Point(s): 19.07
Comments: Retested descending breakout and filled gap from early August. Should bounce back towards 20DMA around 19.5
GS – Short-Term & Medium-Term Long
Target: 170
Entry Point(s): 160, 158
Comments: Plunged through 50DMA and in oversold conditions but should find solid support at descending trendline breakout area as well as 200DMA
ETR – Short-Term Short
Target: 79
Entry Point(s): 81, 82
Comments: Broke to fresh swing highs but denied at previous broken uptrend before plunging back under breakout area. Short into rallies.
Day Trading Charts & Parameters
Futures
Dow 30
Support: 17840,18025 Resistance:18388
Comments: Most vulnerable index out of all as Dow is threatening to be first to break ST trendline. On a break, the early Sept lows will be tested very quickly and likely drag rest of indices down with it.
S&P 500
Support: 2135, 2140 Resistance:2170
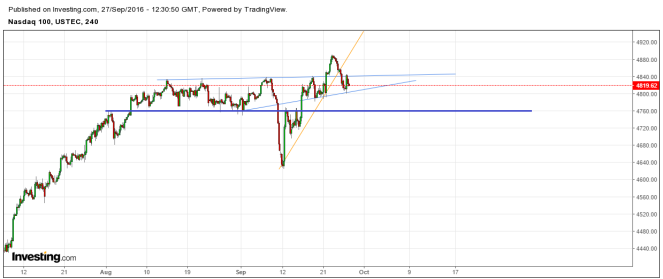
NDX 100
Support: 4760, 4805 Resistance:4840, 4889
Comment: Struggle to get back above breakout area most debate, creating potential H&S pattern. A break of shoulder of 4805 would crumble to 4760 horizontal support
Crude Oil
Support: 44 Resistance:46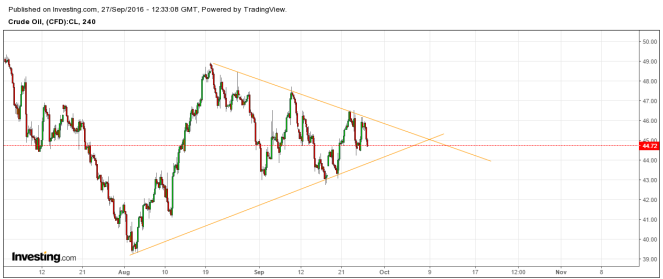
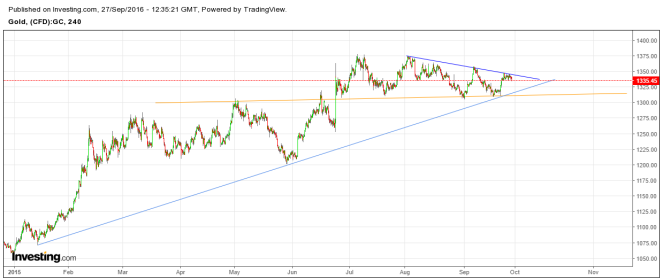
Gold
Support: 1307-1315 Resistance: 1343
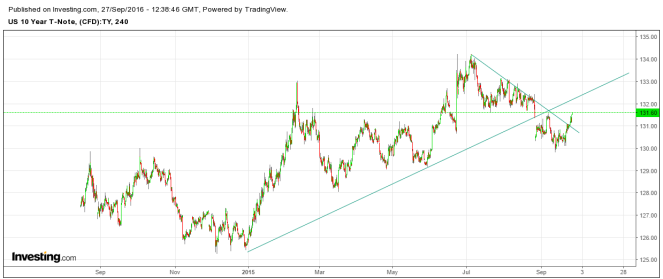
10-Yr Treasury Note
Support: 130.90 Resistance: 132.23
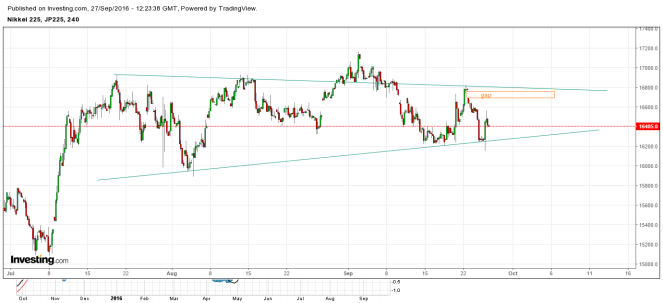
Nikkei 225
Support: 16250 Resistance: 16745, 16800
Currency Pairs
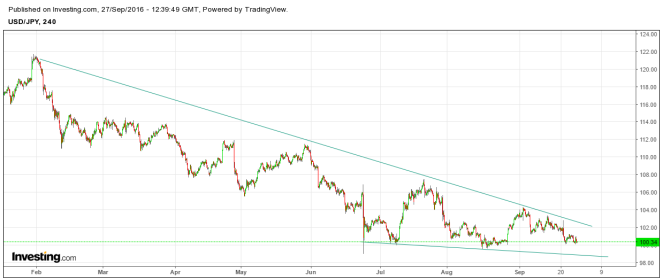
USD/JPY
Support: 99, 100
Resistance: 102.3
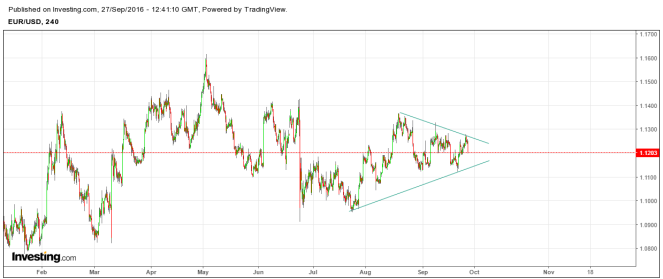
EUR/USD
Support: 1.1144
Resistance: 1.1258
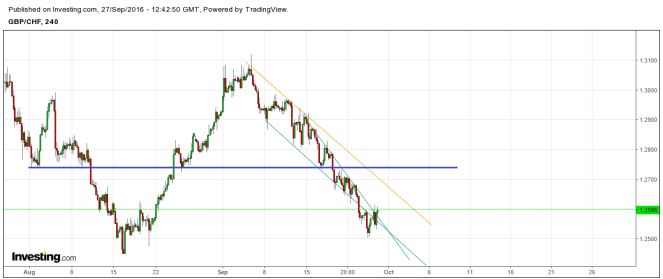
GBP/CHF
Support: 1.2560
Resistance: 1.2588-1.2625
Comments: Looks to squeeze to 1.2700 as we broke out of steep wedge