From today, I am going to publish a daily newsletter with my thoughts on the market and day trading charts/parameters. Once our main WingCapital website is up in running, automated Portfolio Updates & Trade Signals will also be included.
Market Commentary
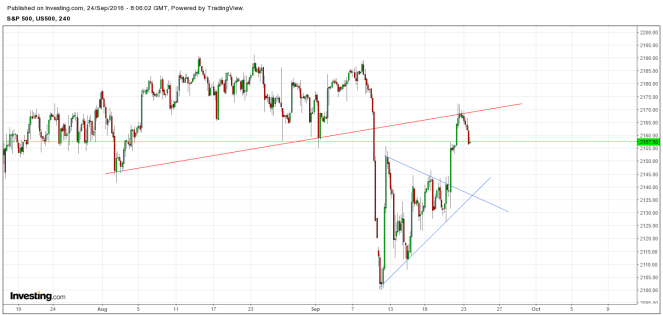
At last, the long-awaited announcement from two major central banks in BoJ and Fed came out last week. As markets widely expected, the former made a twist to its QE program but basically continues doing more of the same while the latter held rates on hold to soothe markets until after election. Investors welcomed the announcement with a boost in the equity markets, up about 50 points in SPX from Wednesday to Thursday before pulling back modestly on Friday. Week over week, SPX rallied just over 1%, while the outperformer index was Russell 2000, up 2.4% on the week.
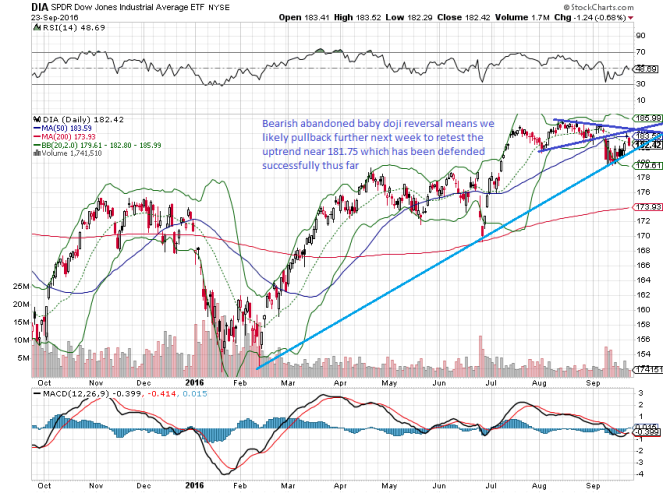
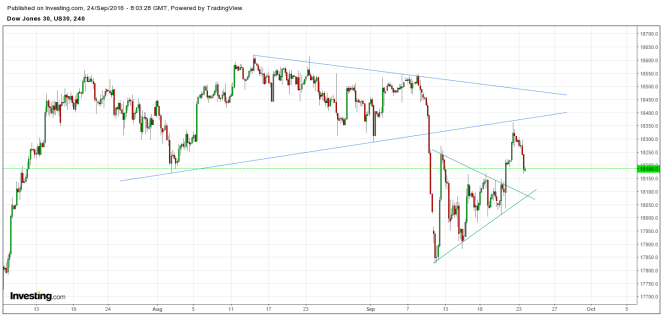
Now that the jolt from central banks is over with, the baton is now passed on to US Election and earning season ahead. Indeed, the uncertainty with US Election will most likely inject more volatility back into the market sooner than later. Technically, Friday’s weak close in major US equity indices ensures further choppiness ahead. The chart in DIA (Dow ETF) is most telling, as it formed an abandoned baby doji reversal which has bearish implication. We likely oscillate between tight range of 181 and 184 until we break one way or another.
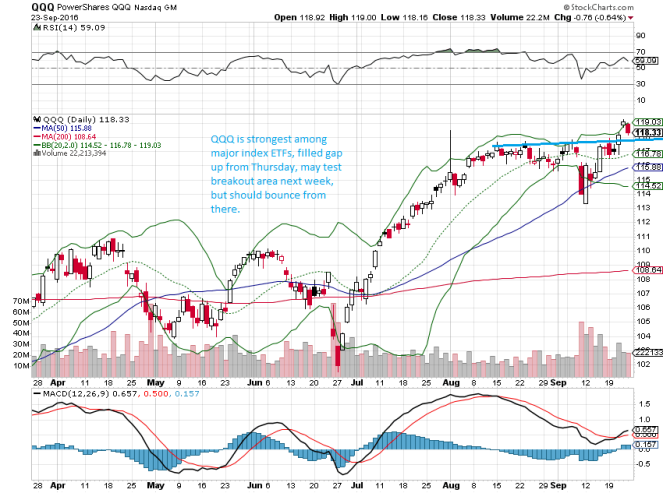
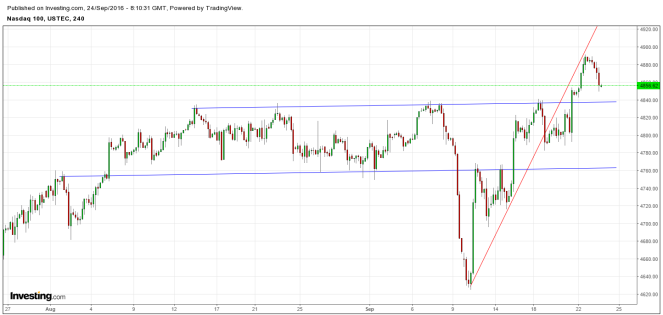
The outperforming index has been Nasdaq (QQQ) as it broke out to fresh all-time highs on the heels of Fed announcement. We pulled back on Friday to fill gap and may retest the breakout area. A quick scalp trade would be to go long at breakout area for a bounce.
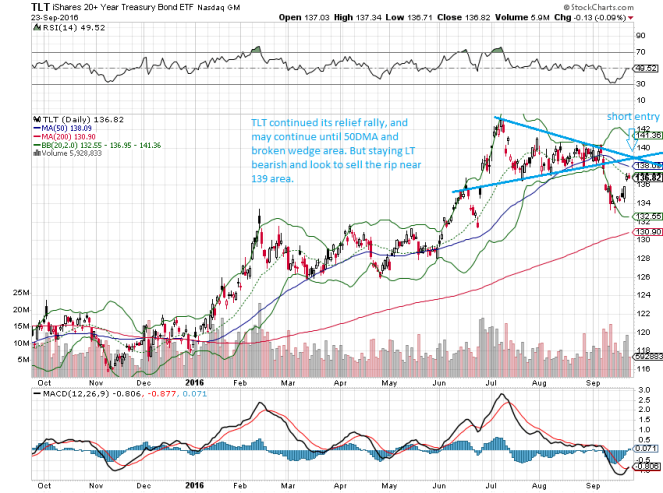
Another chart we ought to focus on is the long bonds (TLT), as Fed’s dovish announcement also provided a boost, but in the LT technical picture it appears we have peaked and it is merely a relief rally to backtest previous broken wedge formation. Good risk reward short entry near 139 area. Another alternative is to buy the TBT.
The outcome of Monday’s Clinton-Trump debate could significantly shape the landscape of US election. Race has tightened with Trump catching up to Clinton, and per Reuters,
“Democrat Hillary Clinton, suddenly vulnerable in the presidential race, is under pressure to deliver a strong performance against Republican Donald Trump in their first debate on Monday, a moment that could be the most consequential yet of the 2016 election.”
Source: http://www.reuters.com/article/us-usa-election-debate-idUSKCN11S0XF
As this is not a political blog, I don’t intend to get into predicting who would win, but I’d be interested in how it impacts which direction the markets move. The general consensus is that a Clinton victory is positive for the market, while a Trump victory is negative. Indeed, as published on McClellan’s website, there is empirical evidence that polls and markets have some degree of correlation:
http://www.mcoscillator.com/learning_center/weekly_chart/djia_leads_poll_numbers/
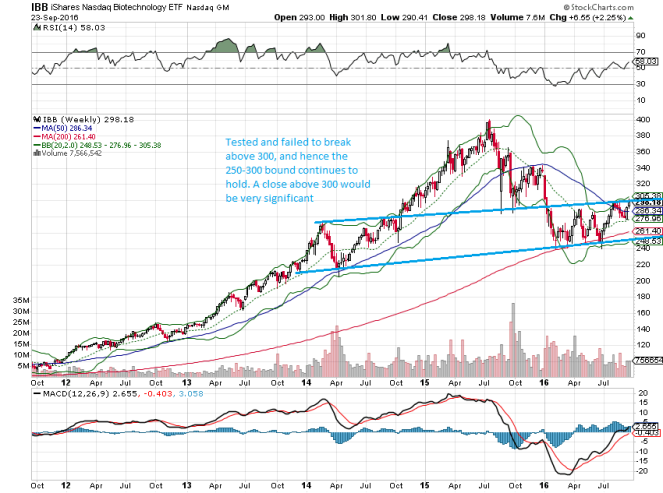
Thinking out loud, contrary to broader market correlation with Clinton/Trump victory, the two sectors that may have an inverse correlation would be Biotechs (IBB) and Healthcare (XLV). As widely reported, Clinton is keen to go against aggressive drug pricing, and her outburst led to plummeting of the likes of Mylan (MYL).
So would a Clinton defeat actually be beneficial for XLV and IBB in general? Technically, IBB had a strong 2 week performance after bouncing off 20WMA, but LT picture remains bounded between 250 and 300. IBB tested the 300 area last week but failed to close above it on weekly basis on broader market weakness on Friday. We will see if it can finally get over the hump in the coming weeks and the Elections may prove to be the catalyst..
Day Trading Charts & Parameters
Dow 30
Support: 18075 Resistance:18375
S&P 500
Support: 2136 Resistance:2170
NDX 100
Support: 4835 Resistance:4890
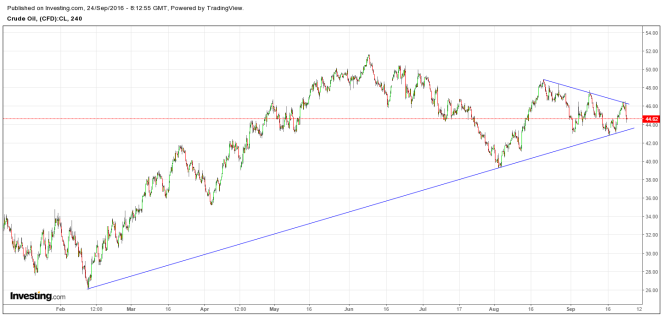
Crude Oil
Support: 43.5 Resistance:46
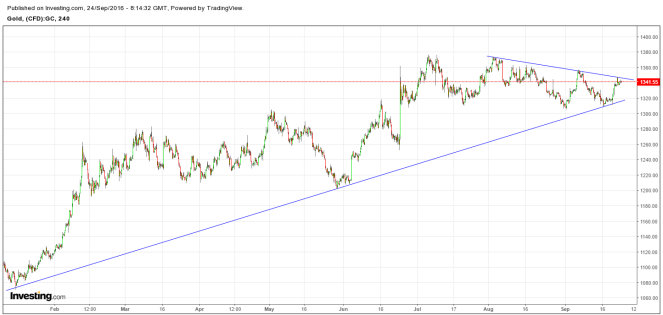
Gold
Support: 1315 Resistance: 1344
10-Yr Treasury Note
Support: 129.7 Resistance: 131.4

Nikkei 225
Support: 16460 Resistance: 16745, 16900

Currency Pairs
USD/JPY
Support: 100.4
Resistance: 101.18, 102.3 (major) 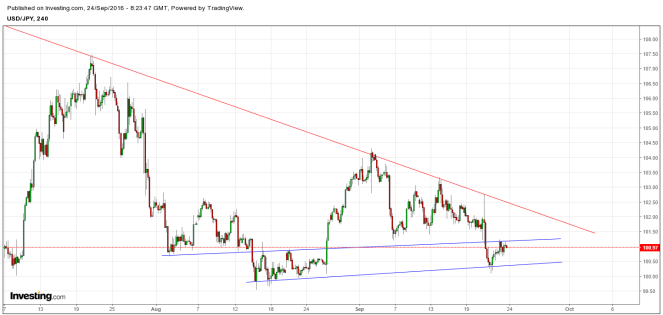
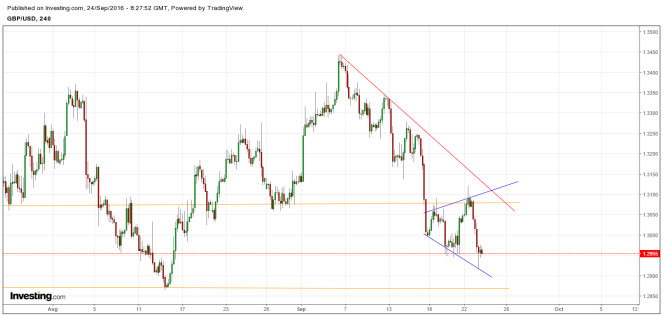
GBP/USD
Support: 1.2903, 1.2867 (major)
Resistance: 1.3080 – 1.3100
GBP/CHF
Support: 1.2560
Resistance: 1.2588-1.2625
Comments: Huge inverse H&S pattern and statistical signal is flashing a high-probability buy. Buy here with a stop below 1.2560, and add on break of 1.2625 on a 4 hour closing basis.

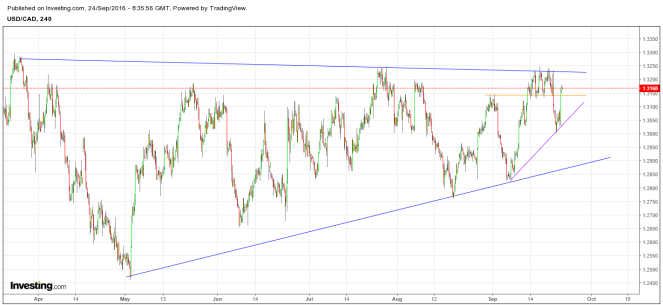
USD/CAD
Support: 1.3142, 1.3055
Resistance: 1.3220 (major)
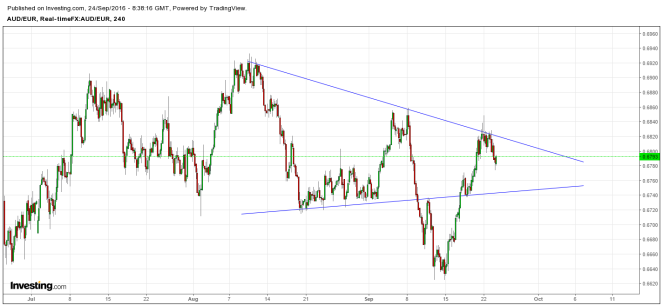
AUD/EUR
Support: 0.6743
Resistance: 0.6817